Testing matplotlib
Matplotlib is a 2D graph plotting library for python. I have been wanting to try it for ages, so finally I did test it out.
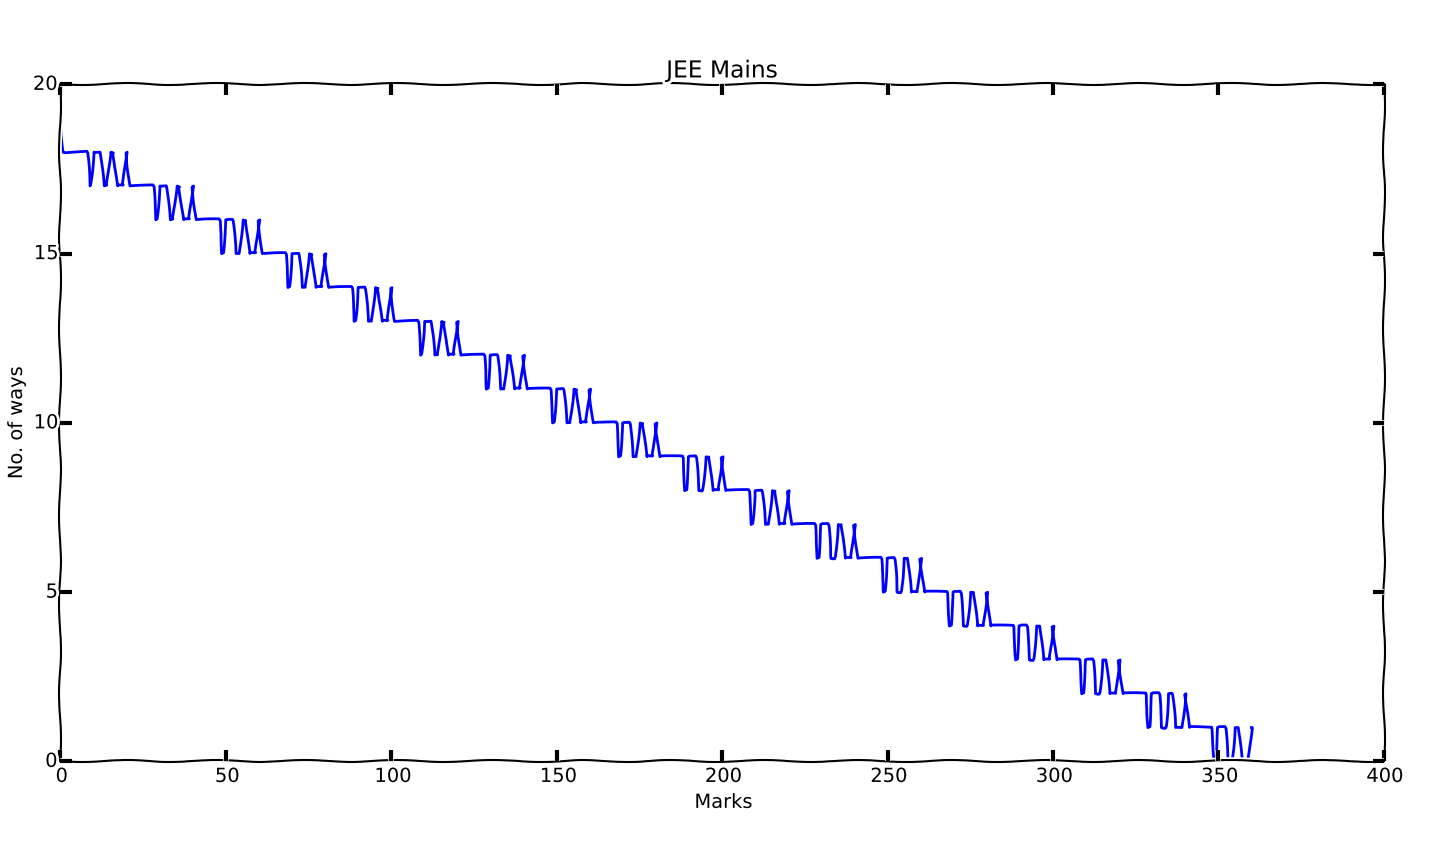
There was a question bugging me while preparing for JEE Mains, how many possible combinations of answering questions correctly/incorrectly can lead me to a particular score.
JEE Mains is an MCQ exam, with 4 marks awarded for a right answer, 1 mark deducted for a wrong answer, and 0 for unattempted questions. It has 90 questions in total, so the maximum score is 360.
For example, to achieve a score of 340, there are two possible ways:
- Attempt all 90 questions, get 86 right and 4 wrong
- Attempt 85 questions and get all of them right
Similarly to achieve a score of 329, there’s just one way:
- Attempt 86 quesitons and get 83 right and 3 wrong
I’ll let the code (and the graph) talk now
import matplotlib.pyplot as plt

m = [0] * 361

for attempted in range(0, 91):
    for correct in range(0, attempted+1):
        score = correct*4 - (attempted-correct)
        if score >= 0:
            m[score] += 1

plt.xkcd()
plt.plot(m)
plt.title('JEE Mains')
plt.ylabel('No. of ways')
plt.xlabel('Marks')
plt.show()
Inference: There are a lot more ways to achieve a low score than a high score, that’s the general trend. But the graph is bumpy. Some scores can be achieved in more ways than the scores just adjacent to them.
